
The Devaluation of Marketing: When Gut Feeling Wins Over Facts
Anyone who regularly scrolls through LinkedIn will recognize the format by now. A slickly designed infographic presents two or three striking figures, a bold conclusion sits above them, and the accompanying text introduces terms such as behavioral design, neuromarketing, framing, choice architecture, and price anchoring. As soon as the author professionally positions themselves as an expert and the first industry peers respond approvingly, the publication rapidly takes on the appearance of authoritative knowledge. The remarkable part is that this is often exactly when something happens that would be unthinkable in almost any other professional discipline: hardly anyone first checks whether the figures on which the entire story rests are actually correct.
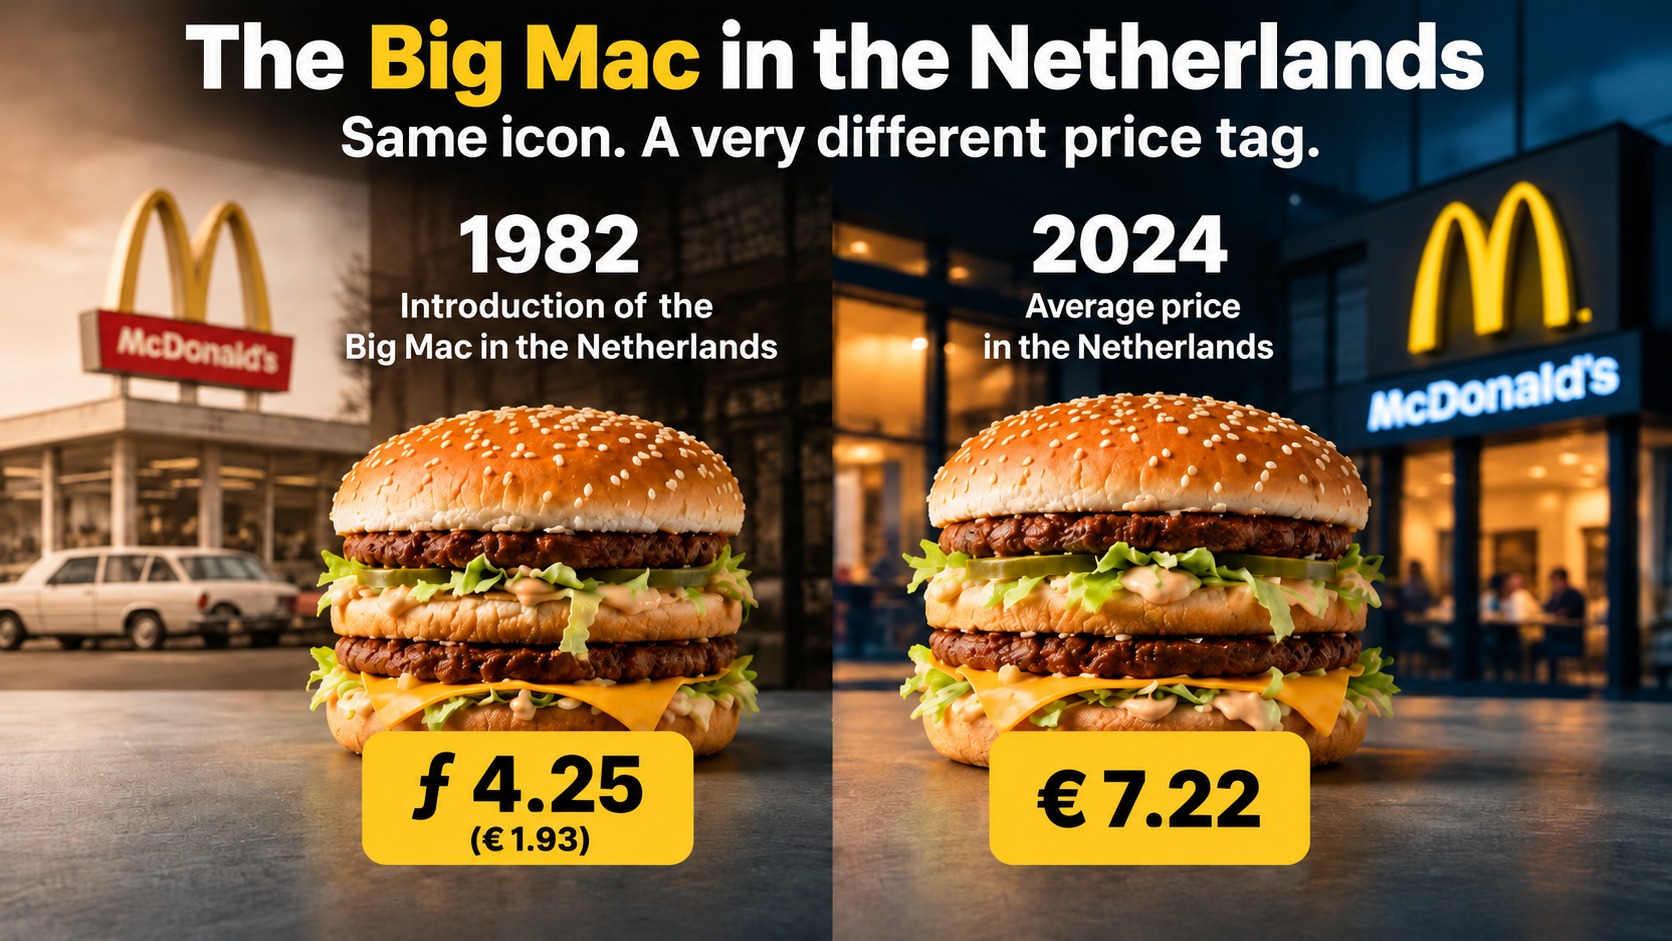
A LinkedIn publication about the historical price development of the Big Mac provides an almost textbook example. The infographic placed a 1982 price next to a 2024 price and then presented an increase of no less than 279 percent. Those two figures were subsequently surrounded by a broad narrative about euros, inflation, price perception, shrinkflation, the brain, and psychological influence. The comments poured in, and other marketing professionals eagerly contributed their own explanations. Anyone looking only at the presentation saw a lively substantive discussion among experts.
Anyone who actually checked the figures, calculations, and source references saw something very different. The amounts used were not even internally consistent, one of the most important historical source references could not possibly be correct, the inflation reference raised further questions, and 42 years of price development had been reduced to exactly two carefully selected data points. At the same time, the illustration showed the modern burger as considerably larger than the historical version, while shrinkflation was being cited in the same discussion as part of the explanation. What was presented as a neuromarketing analysis turned out, on closer inspection, to be primarily a case study in poor data hygiene, missing quality control, and the remarkable willingness of professionals to lend authority to one another.
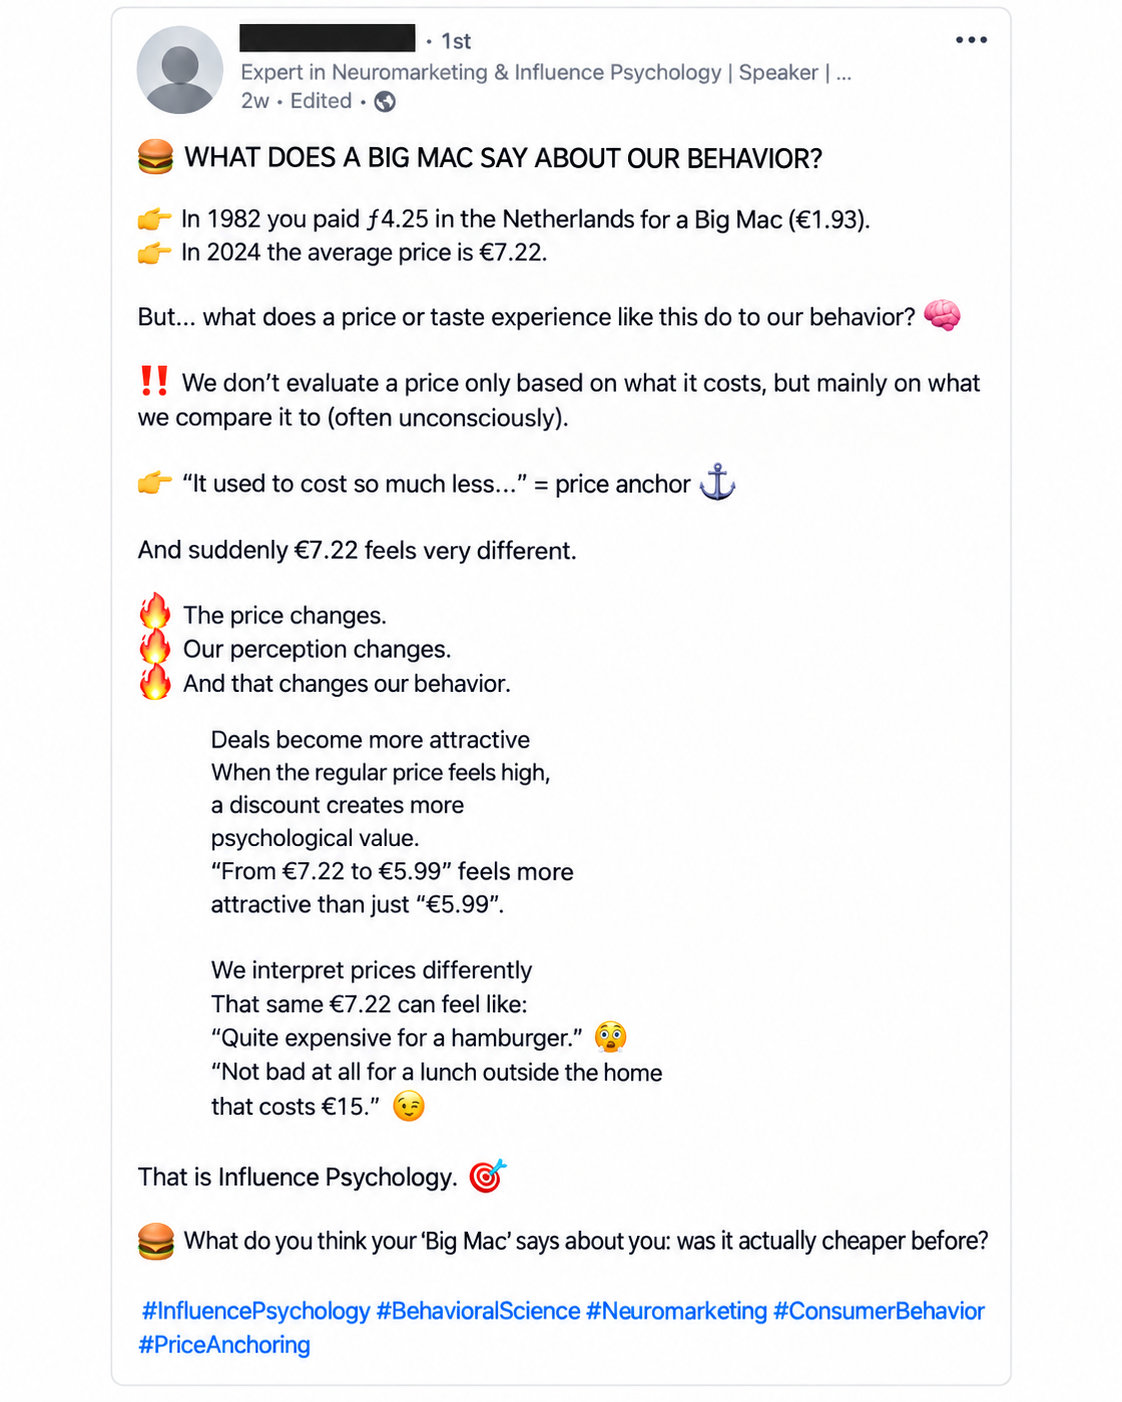
Two Figures Do Not Make a Historical Analysis
The first problem is not even neuromarketing, but basic statistics. Placing a price from 1982 next to a price from 2024 and calculating a percentage change is mathematically possible, but it does not produce a meaningful analysis of 42 years of price development. You have only two observations: the starting point and the endpoint. Everything that happened in between — periods of rapid inflation, price stability, temporary promotions, tax changes, changing commodity prices, wage growth, rental costs, franchise policies, assortment changes, and evolving sales channels — disappears completely from view.
That makes the outcome extremely sensitive to the selected data points. Choose a different starting year and the percentage increase changes. Choose another restaurant, another sales channel, or another price definition at the end of the period and the percentage changes again. With two points you can draw a straight line, but you cannot demonstrate how reality developed between them. Anyone who then uses such a comparison to draw conclusions about structural consumer behavior, price manipulation, or broader social developments is trying to extract far more from the data than the data can support.
In this case, the problem becomes even more serious because even the selected endpoint is unstable. The accompanying LinkedIn post gives a 2024 price of €7.22, while another table within the same material shows €7.32. That difference may appear small until you look at the spectacular percentage used to attract attention. The increase from €1.93 to €7.32 is approximately 279 percent; using €7.22 produces a different result. The figure used to sell the conclusion therefore depends on an amount that changes within the publication itself.
There is an even more fundamental comparison problem in the chosen price basis. In the table, the Big Mac is explicitly listed as “1 item” for both 1982 and 2024. That gives readers the impression that exactly the same product is being compared under exactly the same sales conditions. Yet the discussion surrounding the publication links the modern amount to the context of a complete meal or to a higher delivery price, while that distinction disappears entirely from the table. You are then no longer comparing a standalone hamburger with the same standalone hamburger, but a historical product price with a different commercial pricing context. That makes the reported percentage increase not only vulnerable to cherry-picking, but methodologically unsound as a product comparison.
Precisely because the table presents both amounts under “Big Mac (1 item)”, this is not an innocent nuance hidden in the fine print. The product definition is presented as identical while the pricing context differs, giving readers the appearance of a clean like-for-like comparison that the underlying data do not actually provide.
Anyone attempting a serious price comparison across 42 years therefore needs to document far more than just a starting amount and an ending amount. At a minimum, the following elements must be verifiable:
- the same product definition at every measurement point: standalone Big Mac versus standalone Big Mac;
- the same sales channel, or at least a clear distinction between restaurant, pickup, meal, and delivery prices;
- multiple intermediate data points showing the actual price trajectory across 42 years;
- a reproducible methodology for establishing the Dutch price level, including locations, sample selection, and measurement date;
- economic context such as overall inflation and wage growth, so that a nominal price increase is not automatically presented as deteriorating affordability.
These are not theoretical objections about rounding differences or price definitions. When a striking percentage is deliberately used to generate attention and behavioral conclusions are attached to it, the underlying amounts need to be reproducible. A historical price analysis should also consist of a time series, not two strategically selected dots with 42 years of empty space between them. Anyone who genuinely wants to say something about price development should use the same product definition, comparable sales channels, and multiple measurement points, and then show where changes actually occurred. Without those intermediate data, 279 percent is primarily a powerful headline.
The Source Attribution Collapses as Soon as You Open the Sources
A polished infographic often gains additional authority from a row of familiar source names in the footnotes. Here too, names including The Economist and Statistics Netherlands (CBS) appeared beneath the publication. For many readers, that is probably enough: if names like these appear under a table, someone must have done the research. Source criticism, however, begins after reading the source attribution, not before.
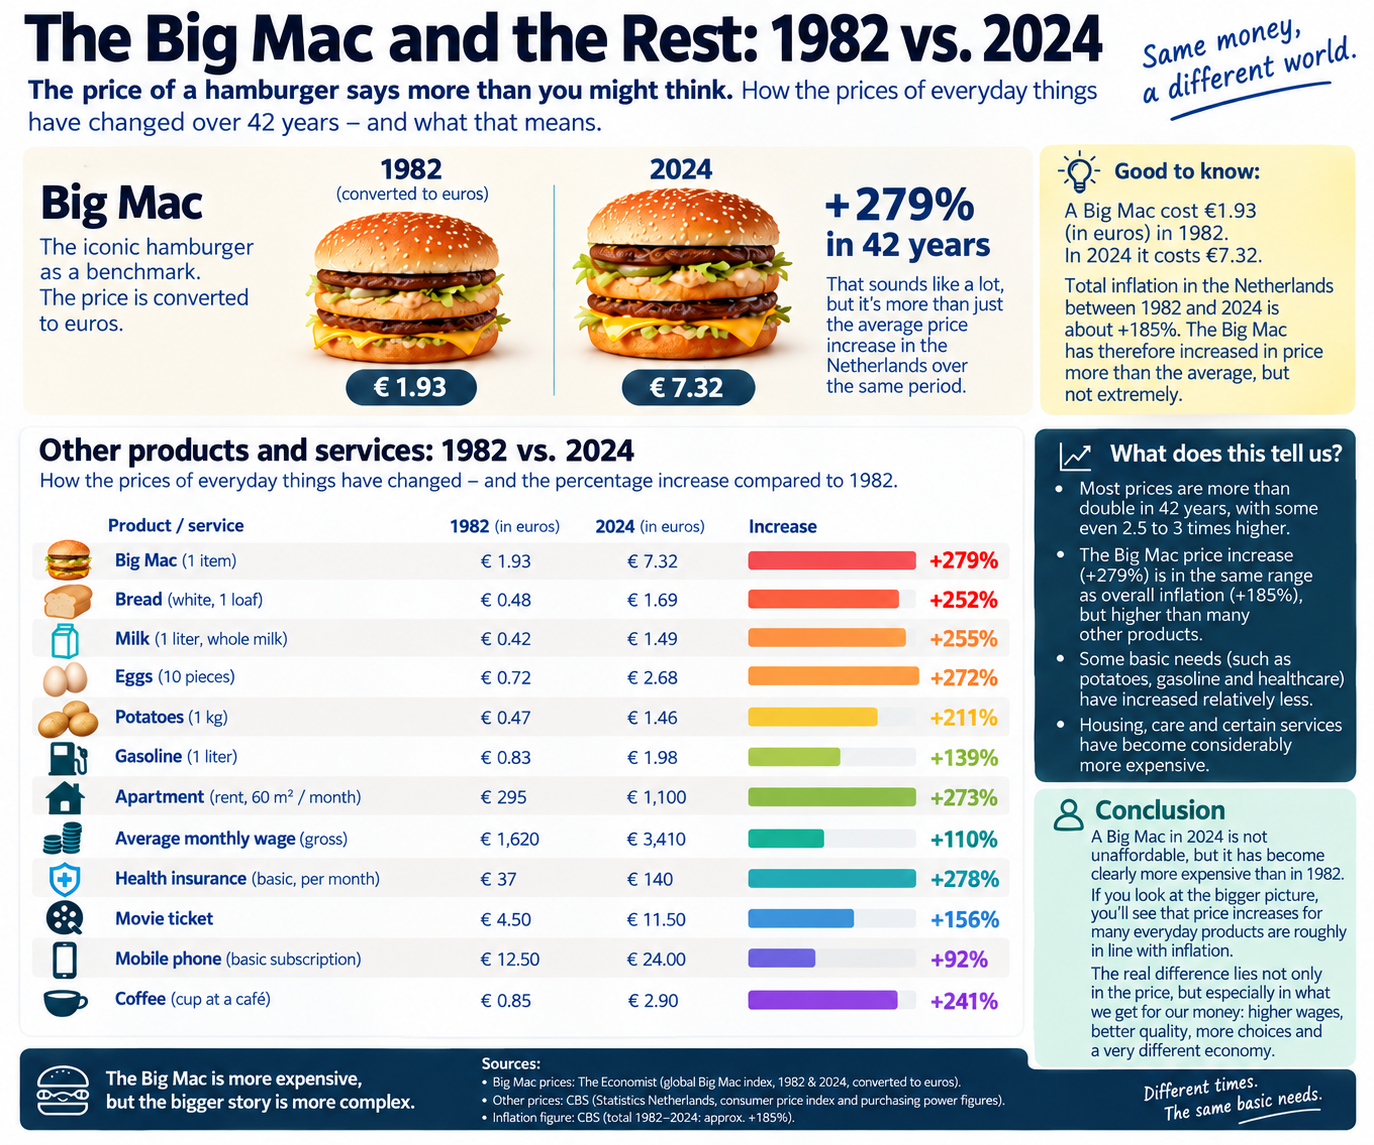
The infographic explicitly cites The Economist for the global Big Mac Index for 1982 and 2024. Yet that index was not introduced until 1986. This is not a matter of interpretation or an alternative economic theory: a Big Mac Index figure for 1982 cannot come from an index created four years later. The public dataset from The Economist also clearly describes its variables and the origins of the Big Mac prices it contains.
When the publication’s main claims are placed alongside its own figures and source references, what emerges is not an isolated mistake but an accumulation of methodological problems:
| Presented in the Publication | What Stands Out When Checked | Why It Undermines the Analysis |
|---|---|---|
| Big Mac 1982: ƒ4.25 / €1.93 | The Economist is cited as source context for 1982, even though the Big Mac Index was not introduced until 1986 | The cited source cannot have provided the 1982 historical data point |
| Big Mac 2024: €7.22 | Another infographic/table within the same case uses €7.32 | The modern starting figure is internally inconsistent within the publication itself |
| Price Increase: +279% | That percentage corresponds to approximately €1.93 to €7.32, not €7.22 | The headline result depends on which of the two modern prices is used |
| Big Mac in Both Years: “1 Item” | The modern amount is linked in the discussion to a meal or delivery context | Different commercial pricing contexts are presented as the same product comparison |
| 1982 Versus 2024 | There are only two data points across 42 years | Two points show a difference, but not a historical price trajectory |
| Inflation of Approximately +185% | The calculation method is not explained in a reproducible way | The authority of Statistics Netherlands is invoked without transparently showing how the figure was derived |
| Shrinkflation as an Argument | The visual actually shows the 2024 Big Mac as larger than the 1982 version | The visual message conflicts with its own narrative about getting less product for more money |
None of these points requires specialist neuroscience to assess. They involve elementary checks of source provenance, product definition, mathematical consistency, and methodology. Because several discrepancies affect the same comparison, the interesting question shifts from “which psychological theory explains this?” to “why was this analysis published without basic fact-checking in the first place, and then accepted by so many professionals as a substantive starting point?”
This creates a problem not only with the source attribution, but also with the historical starting price itself. Historical Dutch McDonald’s menus from the early 1980s show standalone Big Mac prices of approximately ƒ3.25 to ƒ3.50, equivalent to approximately €1.47 to €1.59. The ƒ4.25 / €1.93 used in the LinkedIn infographic is therefore clearly higher. That difference matters because this starting amount forms the basis for the spectacular percentage increase presented later in the publication. Moreover, The Economist cannot be the source for that figure because the Big Mac Index was not introduced until 1986. The primary historical source — McDonald’s own menu from the period — therefore not only points to a different amount but also undermines the chosen source attribution.
Using a single Dutch price for 2024 also requires explanation. McDonald’s Netherlands states in its own terms that each restaurant independently determines its own prices and that prices and promotions may vary by location. Presenting an amount as the average Dutch Big Mac price therefore requires, at a minimum, a sample, a measurement date, a description of the sales channel, and a calculation method. Without that information, “average €7.22” is not a reproducible data point but a figure the reader is simply expected to accept on authority.
The Statistics Netherlands reference does not make the case any stronger. The footnote cites approximately 185 percent inflation for 1982–2024. Compounding the annual inflation figures published by Statistics Netherlands from 1983 through 2024 produces approximately 153 percent price growth relative to the 1982 price level. That percentage is a calculation based on the Statistics Netherlands annual series, not a separate Big Mac adjustment published by the agency. Moreover, the Consumer Price Index measures the average price development of a broad basket of consumer goods and services; it does not provide the historical retail price of one specific hamburger.
The most remarkable point, therefore, is not that a figure can be wrong. Anyone who works with data makes mistakes. The problem is that familiar source names are being used precisely to create the appearance of scientific authority, while those sources do not support the story in the way the presentation suggests when they are actually checked. The authority resides in the presentation, not in the traceability.
Neuromarketing Cannot Repair Bad Underlying Data
At this point, the case becomes more interesting substantively. Price anchoring, framing, and choice architecture are of course serious subjects within marketing and behavioral science. But that is precisely why we must distinguish between a theoretical mechanism and evidence that the mechanism actually played a particular role in a specific situation. Placing a psychological concept above two price tags does not turn those price tags into a behavioral science experiment.
If the premise is that a consumer evaluates today’s Big Mac price against a historical price from 1982, we first need to establish which consumers even know that historical amount, how strongly they remember it, what other price references they have accumulated over 42 years, and whether that reference demonstrably affects their current choice. A consumer born in 2000 or 2005 obviously has no personal purchasing memory of a Big Mac in 1982. For that consumer, the historical price anchor only comes into existence because someone presents it to them in a LinkedIn infographic in 2026.
That produces a much more interesting question than the original post asks. If a self-selected historical amount is used in an infographic to explain how price anchors influence consumers, while that amount itself is insufficiently substantiated, the publication may first be creating the anchor it then claims to analyze. That is not evidence for the original claim, but rather a demonstration of how easily a convincingly presented number can acquire authority.
The discussion in the comments was subsequently expanded even further with terminology from neuropsychology, including Gamma, Beta, Alpha, Theta, and Delta brain activity. None of this resolves the fundamental problem. EEG terminology can be relevant in genuine neurological research with an appropriate study design, measuring equipment, participants, and methodology. It has no explanatory value for why a historical hamburger price cannot originate from the cited source or why two different endpoint prices are used for the same year. Technical jargon cannot correct a dataset.
Publishing a verifiable figure does not allow you to make an error in that figure disappear by shifting the discussion to feelings, perception, or increasingly complicated jargon.
That is where an important boundary lies between substantive expertise and pseudo-expertise. A specialist does not have to be right every time, but should be able to explain where the data came from, which assumptions were used, and how someone else can verify the reasoning. Once a discussion about verifiable figures turns into a fog of psychological terminology the moment someone asks for the sources, professional language stops being a tool for clarification and becomes a way of escaping the original question.
Even the Visual Tells the Opposite Story
The image used in the publication makes the lack of quality control almost tangible. The Big Mac intended to represent 2024 is visibly larger, taller, and more substantial than the burger shown for 1982. That is already a remarkable choice in a historical comparison because an illustration in such an analysis should not quietly suggest a change in product volume for which no data are provided. It becomes outright contradictory when shrinkflation is simultaneously introduced into the discussion as part of the narrative that consumers are increasingly paying more for less product.
Visually, the opposite is being communicated. The viewer sees a considerably larger modern burger and may unconsciously draw exactly the conclusion the text supposedly challenges: apparently the higher price also buys you more hamburger today. Anyone simultaneously claiming that the product has actually become smaller should at least have checked whether the illustration undermines that argument. In a substantive publication, an image is not merely decorative when the image itself suggests a comparison.
The illustration also demonstrates precisely the risk of generative image production: a model can produce a convincing, attractive, and entirely plausible-looking image without any understanding of the factual relationship it is supposed to represent. Whether an image looks good enough to generate reach is therefore a very different question from whether it is factually appropriate. When the text, figures, sources, and visual are all supposed to support the same analytical story, a human expert needs to check those four components against one another.
There is another issue: the LinkedIn publication was circulating in 2026 while 2024 was being used as the modern endpoint. That is not inherently wrong; historical analyses may of course end in 2024. But it then needs to be presented consistently as a comparison through 2024, rather than quietly functioning as evidence for what consumers supposedly pay today. A two-year difference matters when the argument specifically relies on current price perception and concrete retail prices.
The LinkedIn Echo Chamber May Be More Troubling Than the Original Post
The greatest devaluation of the marketing profession, however, becomes visible beneath the publication. Professionals gather there who apparently feel compelled to expand the original story with their own theories about framing, price perception, inflation, consumer behavior, and the quality of McDonald’s. Strikingly, many of the comments are no longer about the verifiable claim with which the discussion began. Instead, they use the post as an opportunity to add frustrations about McDonald’s, fast-food prices, portion sizes, or broader social developments.
That creates a peculiar reversal. The foundation is not checked, while the theoretical superstructure keeps growing. One commenter introduces a behavioral concept, the next attaches an economic judgment to it, and a third adds a personal experience. As the comment section grows, the original publication gains social credibility, while the amount of genuinely verified information barely increases.
This mechanism is particularly interesting because the commenters themselves gain something from it. Anyone posting a smart-sounding observation about decoy effects, neuromarketing, or framing beneath a popular expert post is simultaneously presenting themselves to the same audience as someone who understands the subject. A form of mutual authority production emerges: followers derive status from participating in the expert’s discussion, while the expert derives authority from the procession of industry peers who apparently consider the premise serious enough to build upon. Nobody needs to explicitly agree not to verify the original data; social validation does the work automatically.
That is precisely why the critical responses in this case matter. The thread included specific questions about the historical price, the difference between €7.22 and €7.32, the calculation, the source attribution, and the economic context. Those substantive corrections remained visibly unanswered, while the author continued responding to other comments in the same discussion. That does not prove why someone chooses not to answer a particular comment, but the substantive outcome is clear: all kinds of side discussions receive attention while the criticism aimed at the underlying dataset remains unanswered.
After such corrections, another familiar social dynamic becomes visible. People who initially added theories enthusiastically do not return en masse to reconsider their earlier agreement. A comment section that initially radiates considerable collective certainty can become remarkably quiet once the underlying figures are challenged. In that sense, the case may unintentionally demonstrate how social influence works better than the original infographic ever did.
Anyone Who Sells Expertise Must Accept a Higher Standard
A mistake in a LinkedIn post is not, by itself, a societal crisis. But the standard changes when someone publicly presents themselves as a specialist, teaches classes, offers training, or sells advice based on that expertise. The publication then becomes more than a personal observation; it also functions as a showcase of professional competence. Readers may reasonably expect concrete figures to have been checked, the cited sources to have actually been consulted, and the analysis to be reproducible enough to withstand critical questions.
That does not mean experts must be infallible. On the contrary, professional expertise becomes visible in the way someone responds to an error. Acknowledging a correction, adding a source, adjusting a calculation, or explaining how an average was derived is more likely to strengthen expertise than undermine it. The opposite happens when a verifiable error remains unanswered while the theoretical narrative simply continues unchanged.
For the marketing industry, this is not a minor issue. Our profession has struggled for years with concepts that become popular faster than they are applied carefully. Neuromarketing, AI, behavioral design, and data-driven marketing are valuable disciplines, but they also lend themselves exceptionally well to superficial authority claims because the terminology sounds complex and many readers cannot immediately evaluate the underlying methodology. Professionals, in particular, should resist that tendency rather than applaud one another uncritically.
Generative AI Makes Bad Knowledge More Convincing Than Ever
AI amplifies this problem because convincing presentation can now be produced at almost no cost. A language model can structure a historical analysis within minutes, process percentages, generate scientifically sounding explanations, and suggest a list of sources. An image model can then add an impressive illustration. Anyone looking only at the finished product sees something that may project far more research and expertise than was actually invested in producing it.
I use generative AI extensively in marketing processes myself, which is precisely why I constantly see the other side of it. Good output requires verification. Product data need to be checked against the source, translations need to be reviewed for substance, calculations need to be rerun, links need to be opened, and images need to be examined for errors the model itself does not understand. Sometimes correcting and verifying AI-generated output even takes longer than producing part of the work manually in the first place.
That does not make AI the problem, and certainly not an excuse. AI is a multiplier. In the hands of someone with subject-matter expertise, it can accelerate research, production, and analysis enormously. Without that human control layer, the same technology can package incorrect data, nonexistent source relationships, and visually convincing nonsense far more professionally than was previously possible. Expertise therefore does not lie in the ability to produce content quickly, but in the ability to recognize when the machine is convincingly making things up.
The Big Mac case is almost too perfect an example. Two data points are expected to represent 42 years of history. The current price changes within the same publication. An index created in 1986 is cited as a source for 1982. An inflation figure does not align with the published series on which it supposedly relies. The visual makes the modern burger larger while shrinkflation is invoked. Then, beneath the post, a group of professionals builds increasingly elaborate theories on top of it without first checking the foundation.
This is not merely an AI problem. It is a quality problem within the marketing profession.
Marketing Does Not Lack Authority — It Lacks Intellectual Hygiene
Marketing will always revolve to a significant extent around perception. We study how people experience brands, why they make certain choices, which prices feel attractive, and how presentation can influence behavior. Precisely because those subjects are complex and not always directly observable, we have an additional responsibility to be rigorous about the parts that can be verified.
A source either exists or it does not. An index began in 1986 or it did not. €7.22 and €7.32 are different amounts. Two observations do not constitute a 42-year time series. An average without a described sample is not reproducible. None of that requires a brain scan, a personal anecdote, or a marketing theory.
The real lesson from this LinkedIn case is therefore ultimately not about the price of a Big Mac at all. It is about a profession that increasingly consumes knowledge in the form of attractive content while its willingness to open the source falls behind. It is about people trying to increase their own professional authority by quickly joining a conversation led by someone who is already perceived as an expert. And it is about a platform culture in which a hundred approving comments can create the impression that something has been thoroughly researched, even when nobody may have checked the first calculation.
That is the devaluation marketing should be concerned about. Not the fact that generative AI can produce texts or images, but the fact that human professionals appear increasingly willing to outsource their critical function to the appearance of whoever clicked Publish. Anyone who genuinely wants to be an expert does not need to showcase their own theory beneath every popular post. Sometimes professional competence begins with something far simpler: reading the footnote, opening the source, checking the calculation, and being willing to conclude that an impressive story does not hold up under scrutiny.
Because in the end, the consumer was not the easiest party to influence in this entire discussion. It was the professionals who allowed themselves to be persuaded by the packaging of expertise.